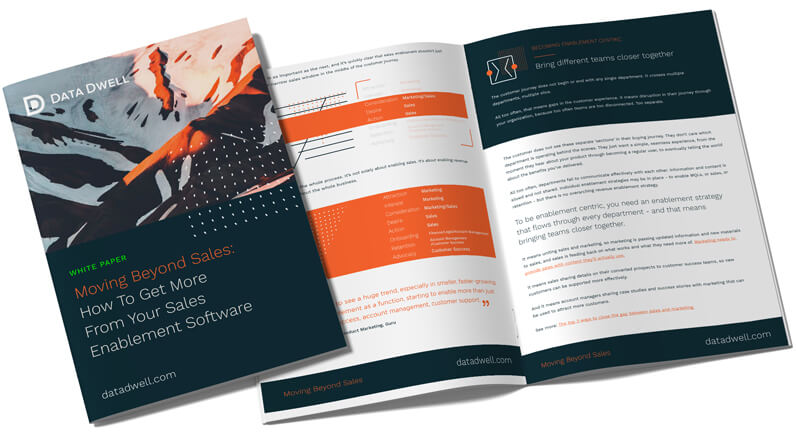

To produce the best type of sales content for your leads and prospects, you need to know which content they like best.
What do they prefer? Which is the most engaging and most effective?
Know this, and your marketing teams can focus their efforts. Your sales team can select content that’s all but guaranteed to generate interest and helps close deals. And your account managers and customer success teams can follow up with content that’s proven to generate revenue.
To understand which content is most effective – preferred by both your teams and your customers – you need to focus on two types of reports.
Two sets of data.
Content engagement metrics and content performance metrics
1. Sales Content Reporting Type 1: Content Engagement
The first type of insight and analytics your organization should focus on is content engagement.
Who’s using and interacting with your content? Who’s accessed and shared your content? Who’s spent time watching a video or reading a white paper, who took one look and ignored the rest?
The deeper your content engagement insight – and the more comprehensive the report – the more you’ll understand how well your content is received.
Does it meet sales reps’ needs? Does it answer your leads’ questions? Does it keep your prospects interested and engaged?
For complete oversight and understanding of content engagement, your sales content management software should be tracking:
- Which content is searched for and accessed by your team… and which never gets seen
- Which content is used by reps… and how often
- Which content is shared with leads, prospects and customers… and at what stage of the funnel
For each individual content piece shared, you should be monitoring:
- Number of opens/views
- Number of downloads
- Number of shares/forwards
- Time spent on content (reading, watching, interacting)
- Average amount of content consumed (e.g. to page 5 or to the end of the document)
- Number of re-opens/re-sends
You should also be able to segment all your analytical data by content type, date, author, industry or vertical, and position in the customer journey, so you can identify trends and understand how different content is used in different sales conditions.
That will help you with the second type of sales content reporting: performance.
2. Sales Content Reporting Type 2: Content Performance
Identifying how your team, your leads and your customers engage with content is vital in understanding how that content is performing.
When you have deep insights into content engagement readily available, you can pinpoint how that engagement affects your results.
Which content actually impacts the sales cycle? Which helps your sales reps close more deals. Which type of marketing content is most effective and which falls short?
To know if your sales content is performing well, you should track important KPIs like:
- Length of the sales cycle – which content, when shared, results in shorter sales cycles?
- Rep non-selling time – is your sales content surfaced automatically and/or easy to find, reducing the amount of time reps spend on admin when they could be selling?
- Number of deals closed – does your sales content get shared in the right place at the right time and increase the likelihood of a signed contract?
- Number of missed opportunities – where are the gaps in your marketing content? Which types of deals/leads/sales are missing relevant content?
The most important content performance report
When you have all this insightful content data at your fingertips, you’ll be able to calculate and monitor the most important performance metric: content ROI.
When you can track how your content performs over every stage of the customer journey, from an initial marketing lead through to your customer success department, you’ll know which pieces drive sales and revenue.
You won’t just be able to say your sales content enables more sales. You’ll be able to pinpoint how much each single piece of content contributes to your revenue, and thus calculate your return on investment.
As long as you can track and report on that content accurately.
Data that dives deep and a dashboard that delivers
That’s where Data Dwell comes in.
It provides the insight you want and the reports you need – all easily accessible and easy to customize via a user friendly dashboard.
It gives you the content and sales metrics that marketing departments need to close the feedback loop.
And it helps you calculate ROI on every individual piece of content, by diving deeper in your engagement metrics and reporting on more data than any other sales content management software.
As Trust Enablement said in their ‘State of Sales Enablement Content Insights Report’:
“One vendor, and only one vendor, actually delivered real insights to power your business and measure the full impact of enablement on your business outcomes. That vendor? Data Dwell.
From a reporting and insights viewpoint, there is Data Dwell, and then everyone else.”
Want to find out exactly why they said that about our sales content reporting and insights?